
 |
Eager Space | Videos by Alpha | Videos by Date | All Video Text | Support | Community | About |
|---|

https://www.ulalaunch.com/docs/default-source/supporting-technologies/launch-vehicle-recovery-and-reuse-(aiaa-space-2015).pdf
https://forum.nasaspaceflight.com/index.php?topic=37390.0
Ever since SpaceX has been flying Falcon 9, United Launch Alliance has been producing information that compares what ULA does to what SpaceX does.
Some people have considered that information to be PR, the kind of public relations material that any good corporation routinely produces to advocate for its products.
Others have chosen a less kind label, claiming the information is full of untruths or outright lies.
Which is it?
We're going to walk through some of those informational exhibits, examine the details, and the you can decide how you would label them.
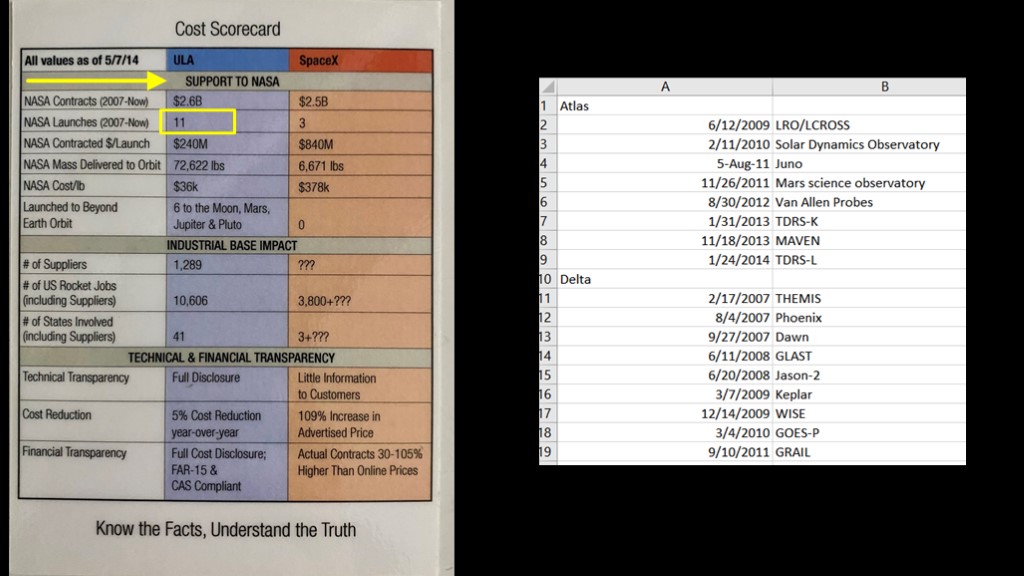
Here's our first exhibit, which I hadn't seen or didn't remember, but luckily Eric Berger posted it a while back.
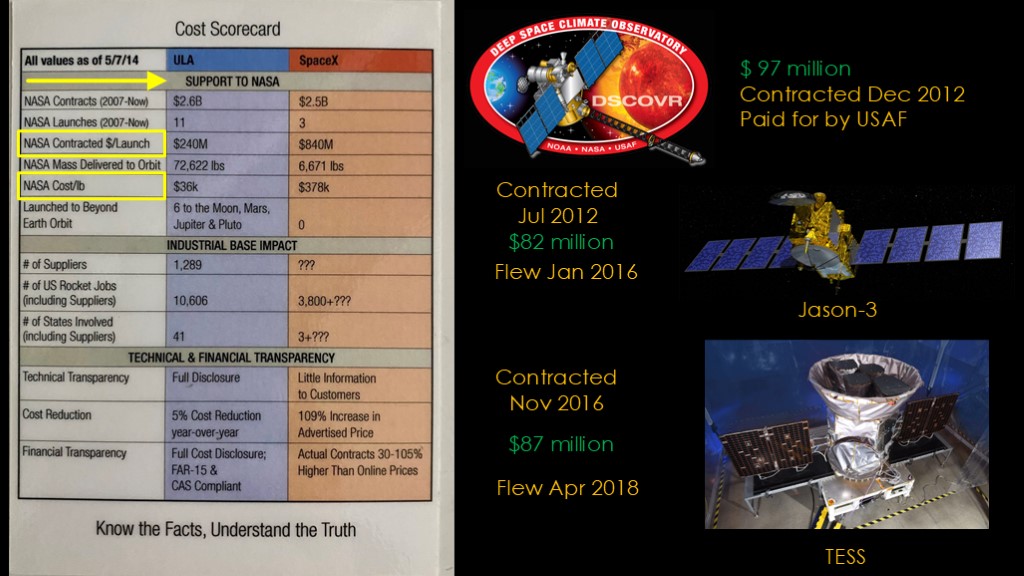
Let's start with the support to NASA section. SpaceX has gotten $2.5 billion from NASA, have only launched 3 times, and that means NASA is paying $840 million per flight. As they say in the PR biz, the optics aren't very good - SpaceX has gotten a ton of money and hasn't given much value back.
My initial goals was to validate all the ULA numbers, but because of the way the contracts were written it was hard to find the data I needed and I frankly got lazy, so I'm going to take them at their word.
At least mostly at their word.
The data says that ULA did 11 launches for NASA from 2007 to 5/7/14. I went looking for data, and I found that they launched 17 missions during that time period.
This is just the kind of attention to detail that makes you confident in a set of data.
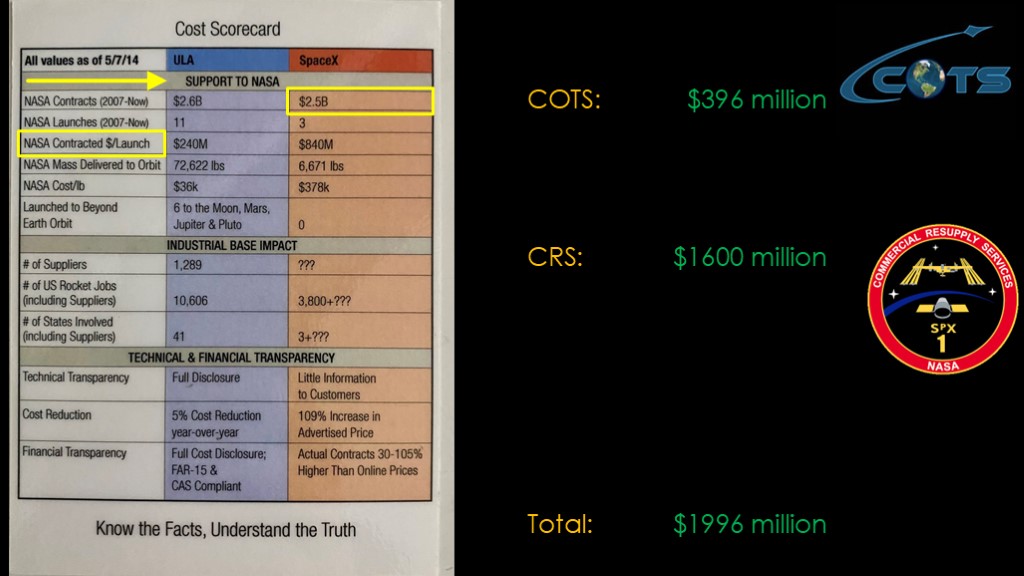
Let's see if we can validate this SpaceX number, the $2.5 billion number.
SpaceX had two contracts during this time period.
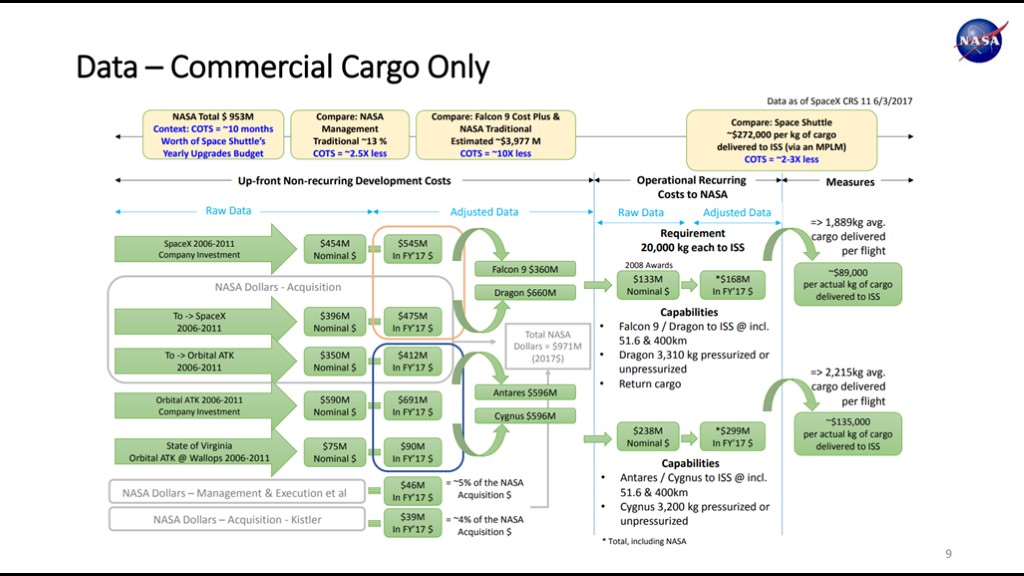
The first is the commercial orbital transportation services, or COTs money that came to SpaceX through a Space Act Agreement (link to funding video here?). This money was spent to develop Falcon 9 and Cargo Dragon. SpaceX kicked in $454 million of their own money for this project
The second is the commercial resupply services, or CRS contract, which was for $1.6 billion dollars for 12 flights
Add those up, and we get a number that I'm going to call $2 billion. Can we find the extra half billion?
NASA did make two launch contracts with spacex in 2016 for Jason-3 and TESS, and that added another $169 million.
The thing that isn't readily apparent is that this scorecard is talking about contracts. Contracts are an agreement to do something at some point in the future in exchange for a given amount of money when that thing is done. In particular, the CRS contract is a "pay as you go" contract; NASA will pay SpaceX some money when they order a mission the balance when the mission is completed.
So the contract number mostly represents possible future payments, not money that has already been paid.
Note that the line in the scorecard very carefully says "NASA contracted $/launch" is does not say "cost per launch". Though you can argue that cost per lb does not do that.
Let's look at the actual SpaceX numbers...
We'll see if there are any other NASA contracts during that time period.
There was the deep space climate observer, otherwise known as DISCOVR. SpaceX got a $97 million contract to launch it, but that contract was made by the Air Force, not NASA, so it doesn't belong here.
Jason-3 was contracted on Jul 2012 for $82 million and TESS was contracted in November of 2016 for $87.
But these two missions illustrate the problem with the approach ULA is using. Companies do not get paid the money for the launch when the contract is signed. They may be paid a small amount along the way, but the bulk of their payment comes when the payload is launched.
These missions were launched in 2016 and 2018, so they don't fall in this period in terms of revenue.
ULA is playing a cute little game here. Note that the label does not say Cost per launch, it says NASA contracted $ per launch. They're taking the amount of contracts awarded in a period and dividing it by the number of actual flights in that same period. And they're implying that it is cost per launch.
A few lines down, they calculate a "cost per pound" metric by taking the total contract value and dividing it by the number of pounds. That's not a true value because they cost they are using is not associated with the flights they are using.
Let's see if we can come up with a better value for SpaceX...
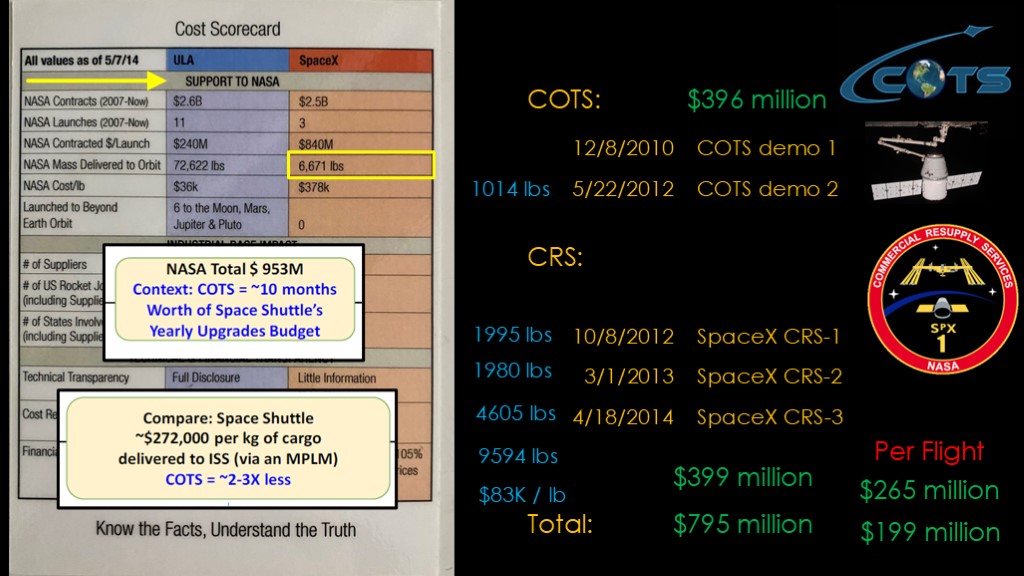
SpaceX flew two demo flights under COTS. The second demo flight successfully made it to the space station.
The cost of both of these flights was covered under the COTS contract, which at this point has been fully paid - SpaceX has received all that money.
There were then three operational CRS flights during this time period out of the 12 contracted. Under the contract, those cost $133 million each for a total of $399 million and an overall total of $ 795 million. If we look at those three flights, that's a per-flight cost of $265 million. If we add in the successful demo 2 flight, that's a per flight cost of $199 million.
The $265 million is pretty close to the per-mission cost of ULA, and the $199 million is less, though as I noted they actually flew 17 flights and the $2.6B they listed is not what they charged for those flights.
Let's go onto the mass numbers. The number they're using for SpaceX is not mass delivered to orbit as a dragon is about 13,000 pounds by itself, but I'm fine with using "mass delivered to the space station".
Here are the mass numbers of cargo delivered by these missions. CRS-3 sees a big jump because it's the first flight of the much larger and more capable Falcon 9 V1.1. The total is 9594 lbs.
I now challenge you to find a reasonable combination of these masses that gives you the 6,671 lbs that ULA claims. I have had no success. These numbers are the ones NASA gives out so they are readily available and I find it confusing the ULA number is wrong.
That 9594 lbs delivered to the ISS comes to $83,000 per lb. That is pretty high compared to the ULA figure, but we need to consider that each of these launches includes a capsule that navigates to the ISS and keeps most of the payload pressurized. It also returns payload back to earth. The ULA numbers are purely the mass of the payload on top of the third stage.
If you include the dragon mass, the number is about $13,000 per lb.
NASA was very pleased with COTs and CRS - the up front cost was $953 million, which was about 10 months worth of the space shuttle's yearly upgrade budget. And the cost per kilogram of cargo delivered was 1/3 to ½ of what shuttle cost.
Moving down to the industrial base impact, I have two things to say.
First, the label on this is "cost scorecard" and none of these are about cost.
Second, if you don't know how many suppliers your competitor has you might as well give up doing comparisons that require knowing that data. I do not doubt that ULA has far more "rocket job" suppliers than SpaceX does, but the question marks here do not inspire confidence.
Finally, on technical and financial transparency...
There is no way that ULA can evaluate how much information SpaceX gives to customers because they are not a SpaceX customer. I do think the ULA payload guides have more information than the Falcon 9 guide, but a) there is a lot of information there and b) it's pretty obvious that customers can ask SpaceX for more information.
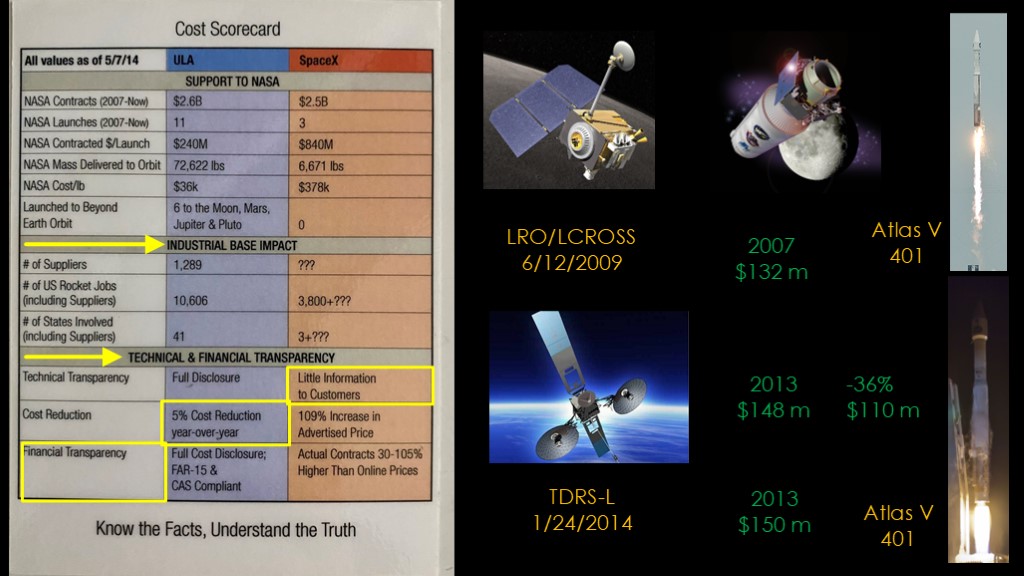
The cost reduction part caught my eye. First, they talk about costs - which are generally the internal costs - rather than price for ULA and then talk about price for SpaceX. I'm going to assume that they mean price for both because customers do not care about internal costs, they care about price.
ULA is claiming a 5% reduction year-over-year.
Let's look at a couple of missions.
In 2009, ULA launched the LRO/LCROSS mission for NASA on an Atlas V 401 rocket, and received $132 million from NASA for a contract signed in 2007.
In 2014, ULA launched the TDRS-L satellite, also on an Atlas V 401 rocket. The contract for that launch was signed in 2013, and in 6 years inflation would have pushed the price from $132 million up to $148 million. With a 5% reduction in cost every year, we would expect that launch to be 36% cheaper, or approximately $110 million.
The TDRS launch was part of a contract for four Atlas V launches that according to NASA cost "approximately $600 million". So the cost of this one launch was around $150 million, or pretty much what we would expect it to cost.
ULA *did* reduce their Atlas V prices considerably a few years later to better compete with SpaceX.
For financial transparency I don't think it's worth the effort to go into the details, but there are two points to make.
The first is that SpaceX is fully compliant with the requirements for working with NASA.
The second is that I'm not sure what point ULA is trying to make on actual prices; the prices on the website are for satellite launches, and the contracts with NASA are flying a cargo capsule to ISS. It's pretty obvious that the prices will be different as the second requires a capsule. It's also very common for government launches to cost extra because they require extra services. ULA knows this as they launched two comsats during this period.
So what do you think about "know the facts, understand the truth"?

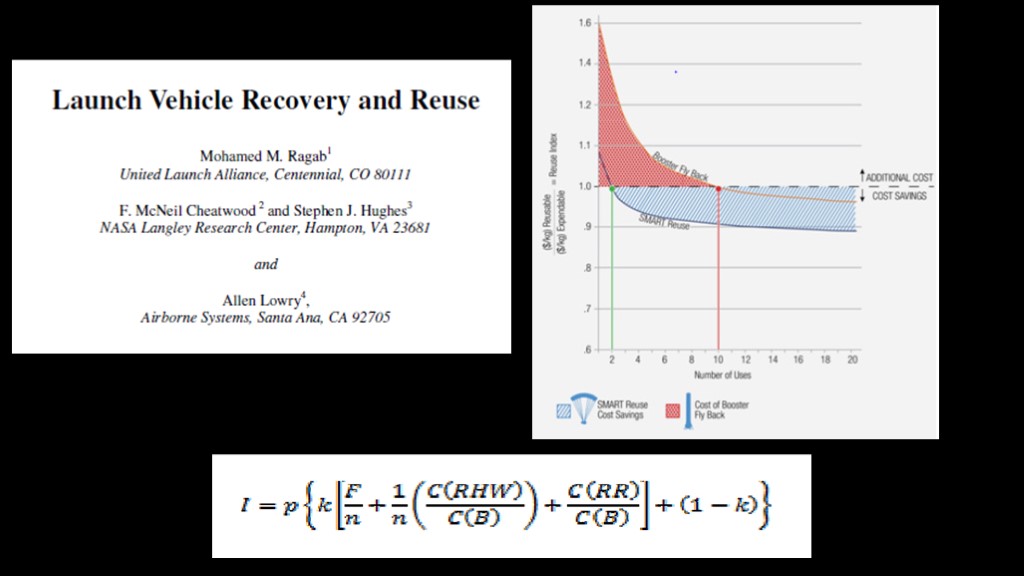
Next, we'll talk about a paper that ULA wrote about launch vehicle recovery and reuse and published in September of 2015. It's mostly about ULA's approach for reuse that they call "SMART reuse", but there's one short section titled that "Economics of Reuse" that has generated a lot of discussion.
I've linked the paper in the description for the video, and I've also included a link to a very interesting discussion about the model on NasaSpaceFlight.com, with links to the spreadsheet.
The model used is fairly complex - overly complex in my opinion - but the part that generated the most heat was this graph which asserted that ULA's SMART reuse approach would reach break-even at 2 flights but it would take the Falcon 9 reuse approach 10 flights to break even.
The math used is fairly ugly so I'm going to try an alternate approach.
But first, we need to talk about differences between rockets...
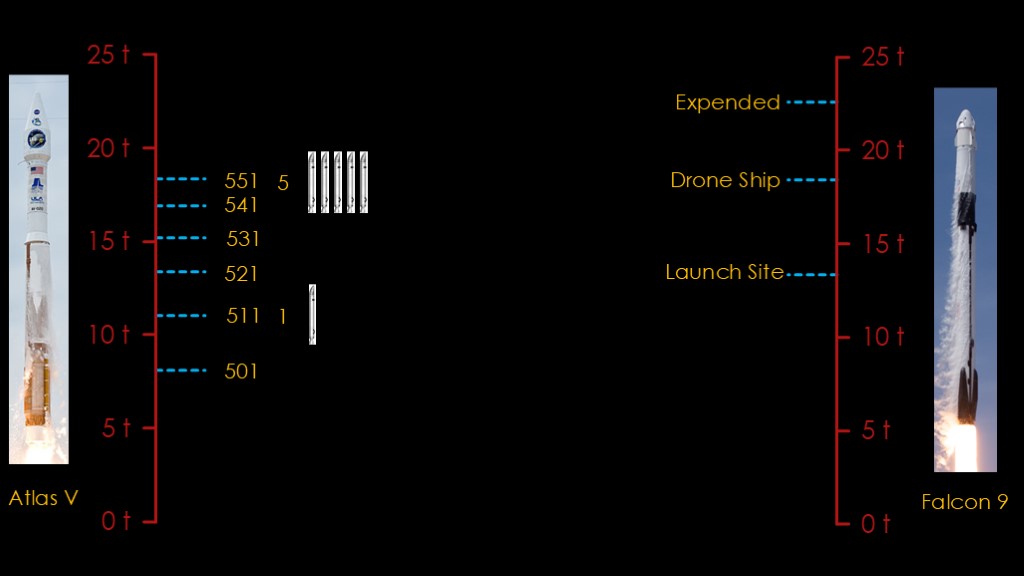
I'm going to use Atlas V because that was the launcher flying at the time the paper was written, but the results apply to Vulcan as well. And I'm going to talk about payload to a 400 km low earth orbit.
Atlas 5 is a "choose your performance" rocket. The base "501" configuration can lift about 8 tons. Add a single solid rocket booster, and that gives you 10.7 tons of performance. Keep doing this all the way up to 5 boosters, which gives you 18.5 tons of performance.
The important point here is that once you get above the 501, there is never much extra performance with an Atlas V.
The Falcon 9 is also a "choose your performance" rocket, but in a very different way. If you need the full performance of 22.8 tons, you can fly expended (you can't actually use this performance for LEO but you can for higher energy orbits).
If you need less than 17.5 tons, you can land on the drone ship.
If you need less than 13.5 tons, you can land back at the launch site.
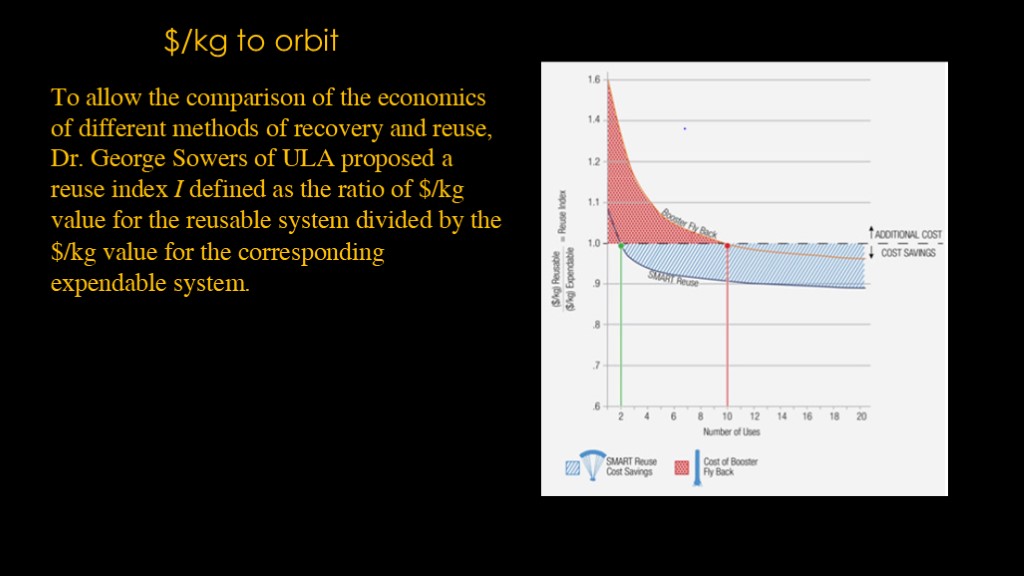
The ULA approach uses $ per kilogram to orbit as their measure.
If you dig into the NASASpaceFlight.com thread on this topic, you will find some discussion with Dr. Sowers about why that metric was chosen.
Let's explore an alternate metric - looking at reuse based on an analysis of likely payload sizes.
7400 (3185kg) - 7420 (8) + 7425 (2) = 10
7300 (2800 kg) - 7326 (2) + 7320 (7) = 9
7900 (6000 kg) - 7925 (31) + 7920 (11) = 42
We can do a simplified analysis based on market data, using the ULA launch data from 2000-2009. I've normalized all these launches as if they were LEO launches to simplify things.
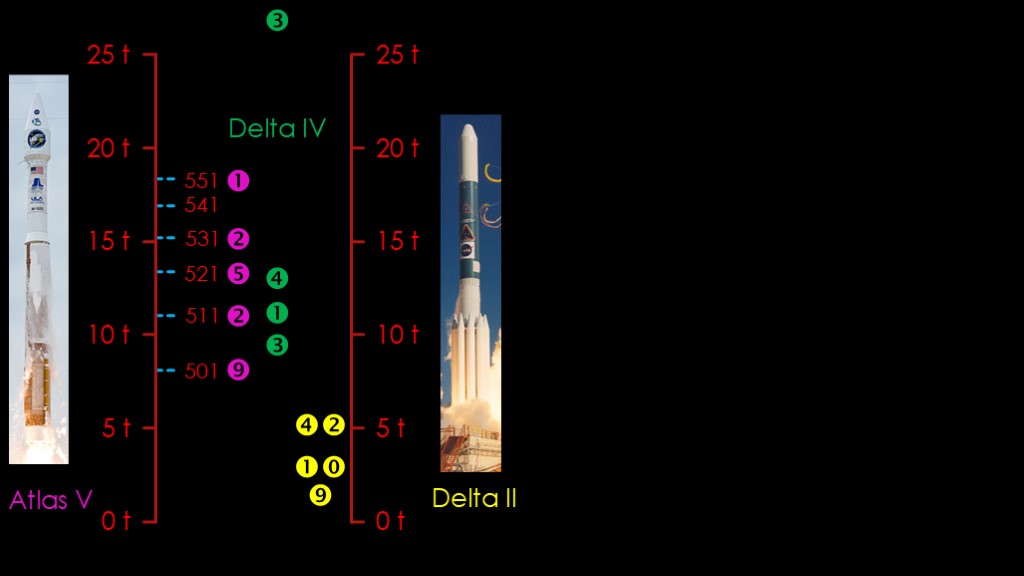
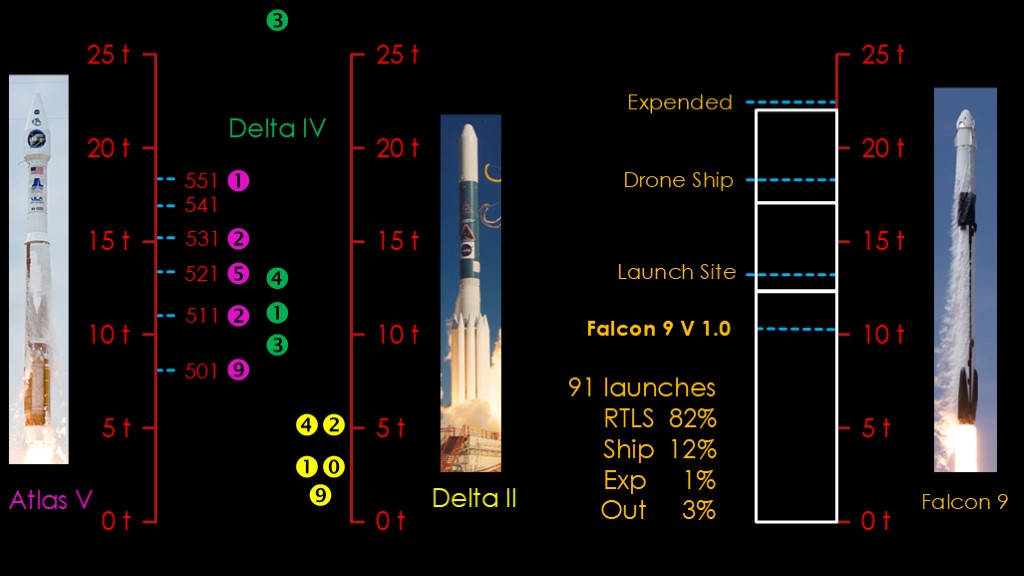
We'll start with the atlas V. It flies with 0 to 5 solid rocket boosters with the configurations 501 for no boosters to 551 for 5 boosters. I've put them on the chart here to show what the LEO capability of each configuration is. And I converted the 4 meter variants to 5 meters. The no booster variant flew 9 times, 1 booster flew twice, two boosters flew 5 times, 3 boosters flew twice, and 5 boosters flew once.
The Delta II was still flying a lot during this period. The 7300 variant flew 9 times, the 7400 flew 4 times, and the 7900 flew a staggering 42 times. Like the atlas V, the vertical location of the number shows the max LEO payload for each of these variants.
The Delta IV flew some. The M variant flew 3 times, the M+(5,4) variant flew once, and the M+(4,2) variant flew 4 times. In addition the Delta Heavy flew 3 times, putting it way at the top of the graph.
ULA flew 91 flights , and this provides a reasonable approximation of what the government commercial market was during this decade.
. Looking at the Atlas V launches from 2000-2009, there were 9 launches with no boosters, 2 with 1, 5 with 2, 2 with 3, zero with 4, and 1 with 5.
This data is skewed from a market perspective because it's just US government launches, but it's a starting point.
Let's push those over to the SpaceX side, nothing that this is a little unfair because these are Falcon 9 2024 capabilities.
Starting at the top, we end up with one payload that needs an expendable ride, seven that can use drone ship recovery, and 11 that can use return to launch site
Delta IV Medium had 8 launches during this time, in three different variants. I'm going to charitably say half of those are drone ship and half of those are return to launch site.
Of 31 launches, 1 would be expendable class, 11 would land on the drone ship, and 19 would land at the launch site, for a total of 30 out of 31 reusable launches with no loss of payload.
The big point here is that reuse depends on how your rocket size relates to the size of payloads that customers want to launch. Falcon 9 version 1.0 could only lift 10.4 tons to low earth orbit, so it would only have been able to lift 12 of these payloads and only in expendable mode. Reuse on Falcon 9 Version 1 would not have been practical.
What would that market allocation mean for a launcher like the Falcon 9.
The falcon 9 can carry 22.8 tons into LEO in expendable mode - though it would need changes to the payload adapter and second stage to carry that much. It can carry about 17 tons with recovery on the drone ship, and about 13 tons with recovery back at the launch site. Let's overlay our ULA market data on our scale.
Before we evaluate these, we need to do a bit of a mental adjustment. Most of these launches were not launches to LEO and the ULA launchers have a bit of a payload advantage on higher energy orbits, so they payload numbers for all of these launches need to be pushed up a bit. What do we notice?
All 61 of the delta II launches, 11 of the Atlas V launches, and 4 of the delta IV launches can all be handled by Falcon 9 in the return to launch site scenario.
11 of the launches could be handled by a first stage landing on the drone ship.
Only one launch required expending the booster.
And three launches - the three Delta IV Heavy launches - could not be handle at all by the Falcon 9.
If we do some statistics, 82% could be handled by landing at the launch side, 12% by landing on a drone ship, and 1% by expending the booster. 3% would require a different rocket.
The key is to correctly size the rocket to the market. If we look at the payload capacity of the Falcon 9 version 1.0, we see that it *maybe* could have been reusable with the delta II payloads but it could not have carried most of the Atlas V or Delta IV payloads.
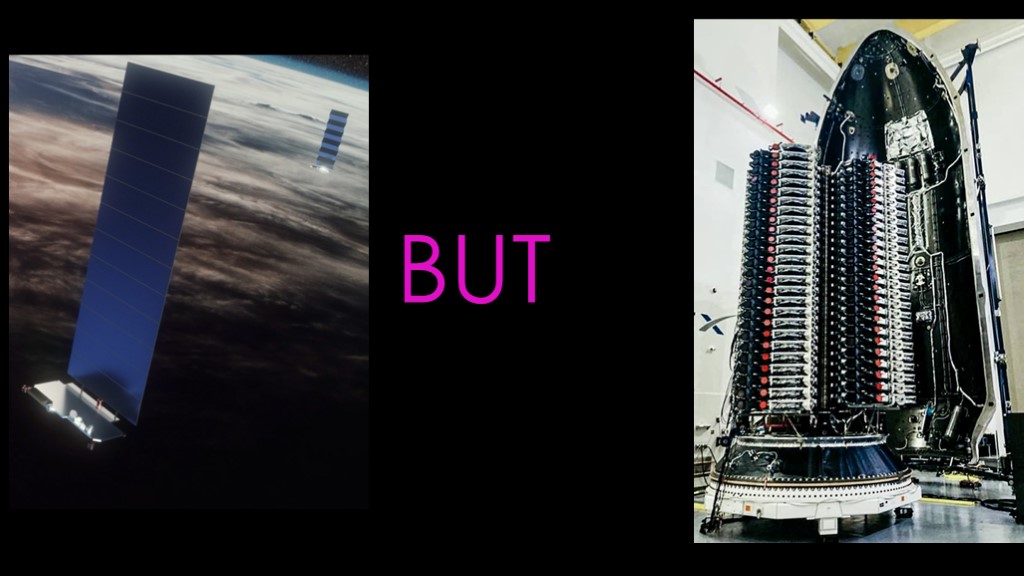
But there is a case where the dollars per kilogram to orbit may be more applicable. And that is constellations...
I don't want to try to explain the model from the paper, so we're going to go with one that I believe is simpler.
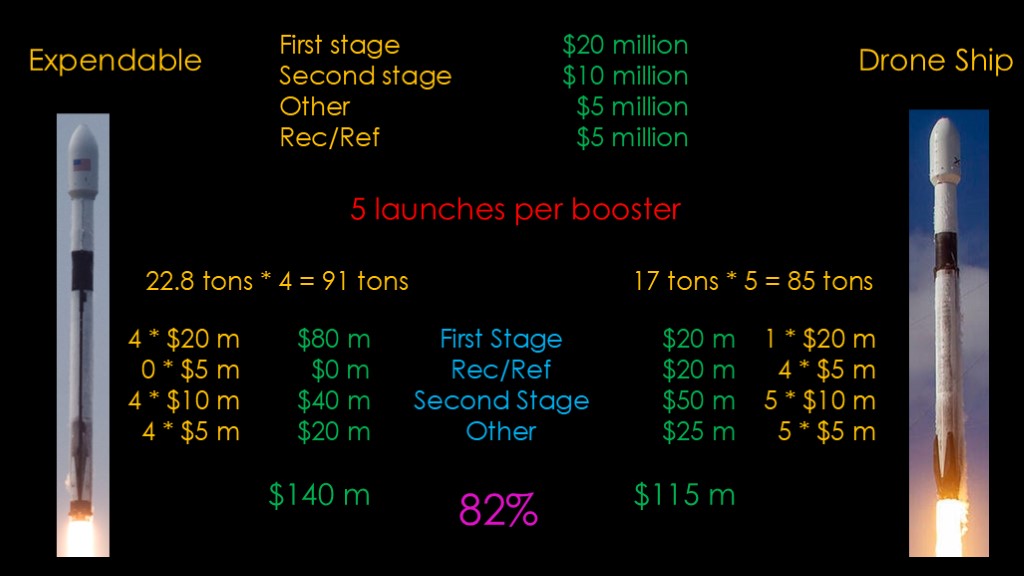
We are going to be comparing Falcon 9 in expendable mode to Falcon 9 with the first stage landing on the drone ship.
And let's just throw some numbers at the overall cost. As usual, these numbers are for entertainment purposes only and do not constitute real Falcon 9 costs.
We will say the first stage costs 20 million, the second stage costs 10 million, and there's another 5 million someplace. And we'll also say that recovery and refurbishment costs 5 million dollars.
We'll start with boosters that are flown 5 times. The reusable vehicle carries 17 tons 5 times, for a total of 85 tons. The expendable vehicle caries 22.8 tons 4 times, for a total of 91 tons. It's about 7% more than the reusable scenario.
For the expendable scenario, we buy four first stages at $20 million each, four second stages at 10 million, four others at 5 million each, for a total of $140 million. For the drone ship, we buy one first stage, four recovery and refurbishings, 5 second stages, 5 others, for a total of $115 million. 82% of the expendable cost
You can push these numbers around pretty easily. Push the cost of the first stage down, the cost of refurbishings up, or the payload penalty up, and you can easily make the expendable version look better.
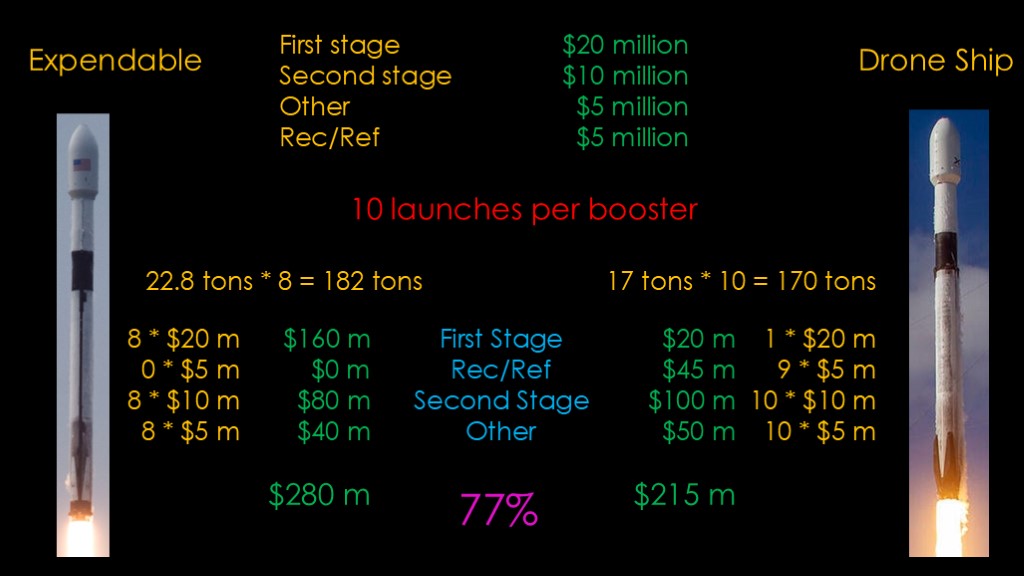
If we bump that up to 10 launches per booster, we get down to 77%.
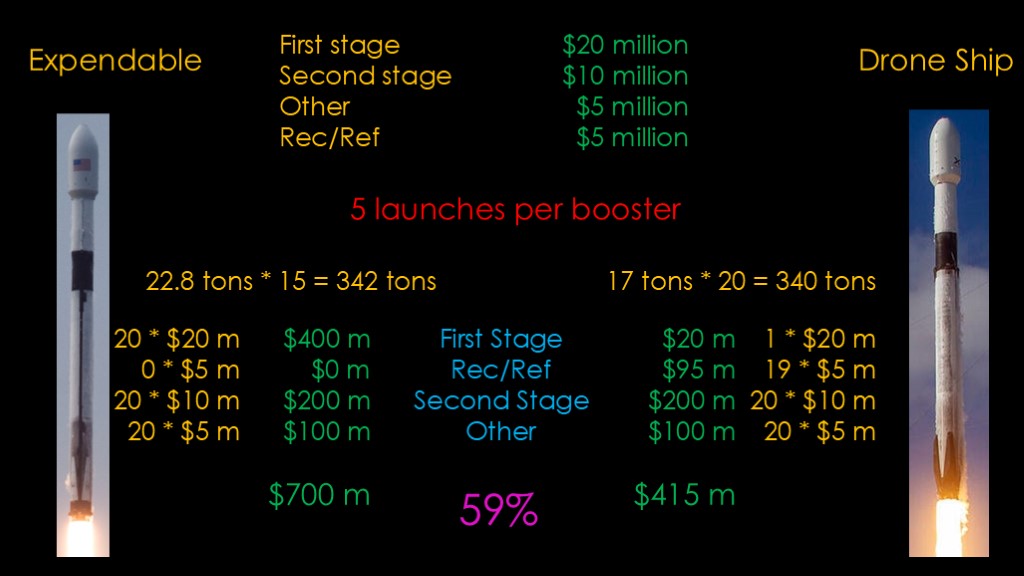
At 20 reuses, it goes to 59%.
Note that the savings is likely underestimated, especially in this scenario. The factory space and workforce required to build 20 first stages and 20 second stages will be significantly more than building 1 first stage and 20 second stages, and the increase in fixed costs would be make the expendable scenario more expensive.
The ULA analysis is less broken in this scenario, but I think the real problem is that they chose some values that happened to make their point look good and didn't bother to show other cases where they didn't look so good.


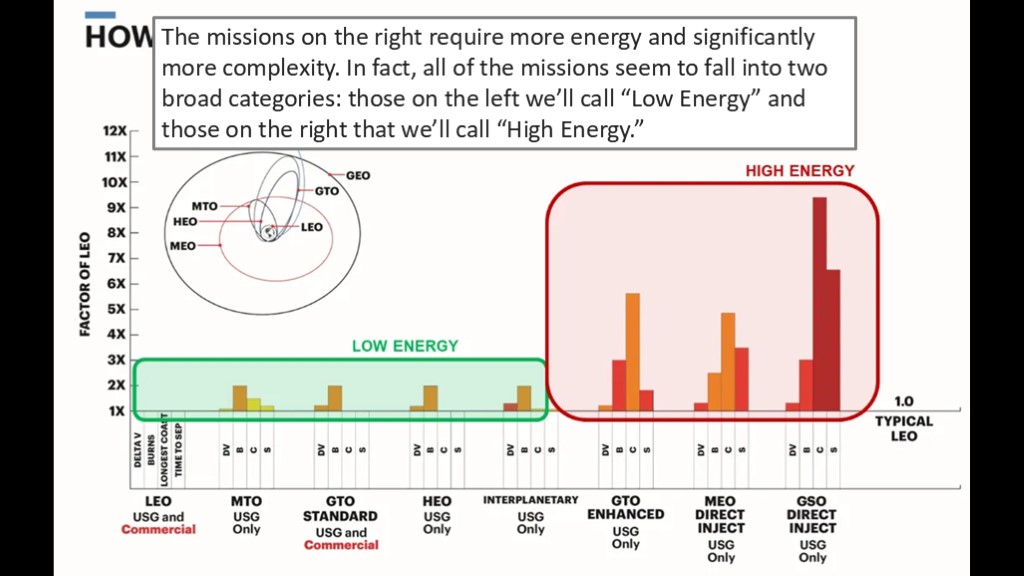
We start with a fun graph, a modification of one used previously.
It lists 8 different destinations and then groups them into one group that is "low energy" and another that is high energy.
If we read the associated text, it says the following:
The missions on the right require more energy and significantly more complexity. In fact, all of the missions seem to fall into two broad categories: those on the left we'll call "Low Energy" and those on the right that we'll call "High Energy."
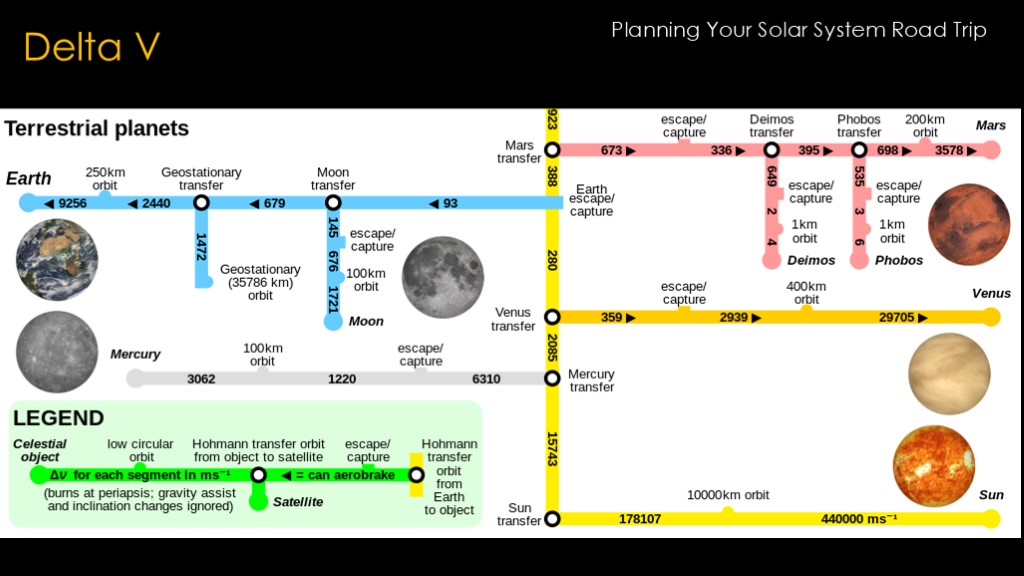
In rocketry, we talk about energy in terms of "delta v", which is the amount of velocity change we need to be able to make to our spacecraft to get into a specific orbit. If you want the details, see my "planning your solar system road trip" video.
This image is a delta-v map of the terrestrial planets in the solar system.
Starting on the earth's surface, it takes about 9300 meters per second of delta v to get into a low earth orbit. If you want to go to a harder destination, it will take more energy - if you want to send your payload to the moon it will take about 3100 meters/second of additional delta v. Even though we express it in terms of velocity, it's really a measure of energy.
To get a payload to the moon, the rocket has to have a lot of propellant left over when it gets to low earth orbit, and therefore it can't as much payload. The moon is a higher energy destination.
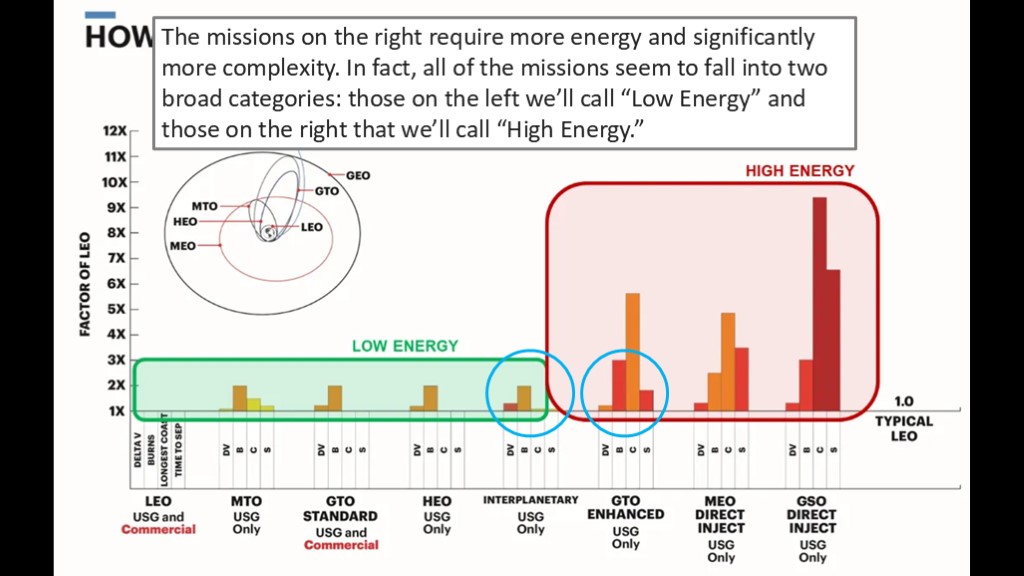
But ULA has decided that they are going to redefine a commonly understood concept in a different way.
They do include delta V as one of the things they show, but note that the delta v in the "high energy" GTO enhanced mission is lower than the "low energy" interplanetary mission.
The other factors they chart are the number of burns that the second stage needs to make, the longest coast time the second stage makes, and the time to separation, presumably after the last burn.
What they are trying to convey is the kind of second stage that you need to complete these missions, which is a fine concept. Maybe they could convey it in a different way:
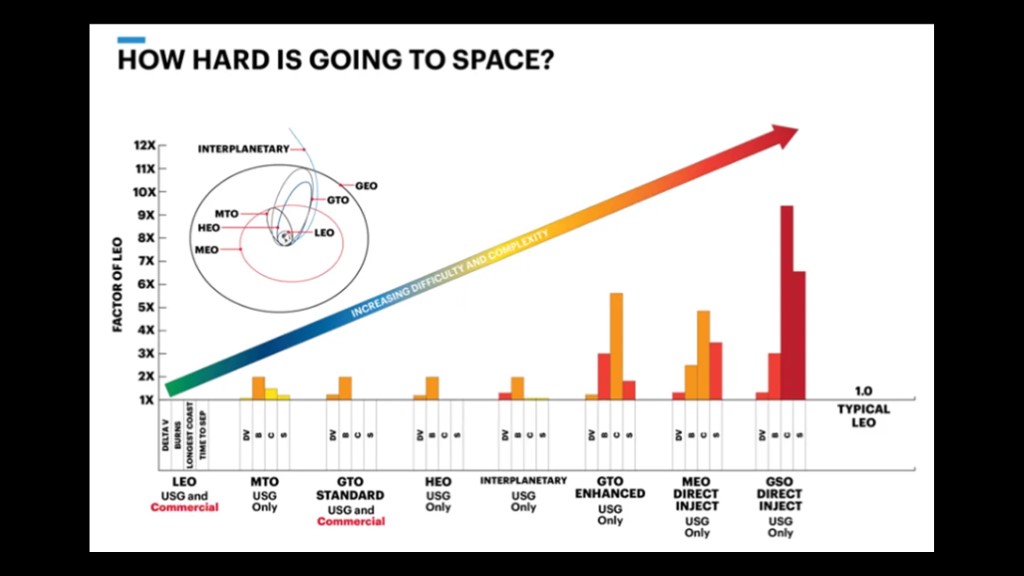
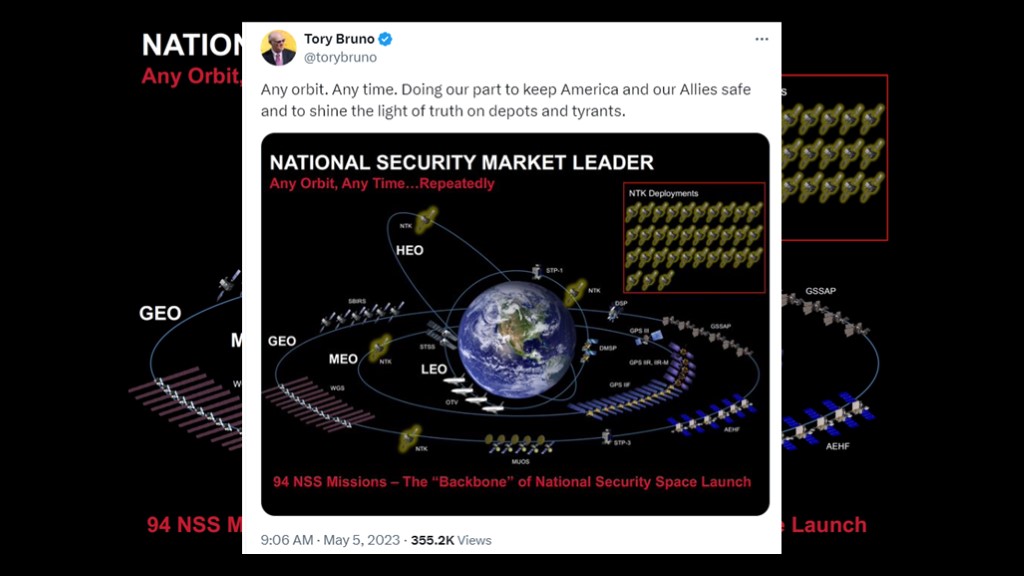
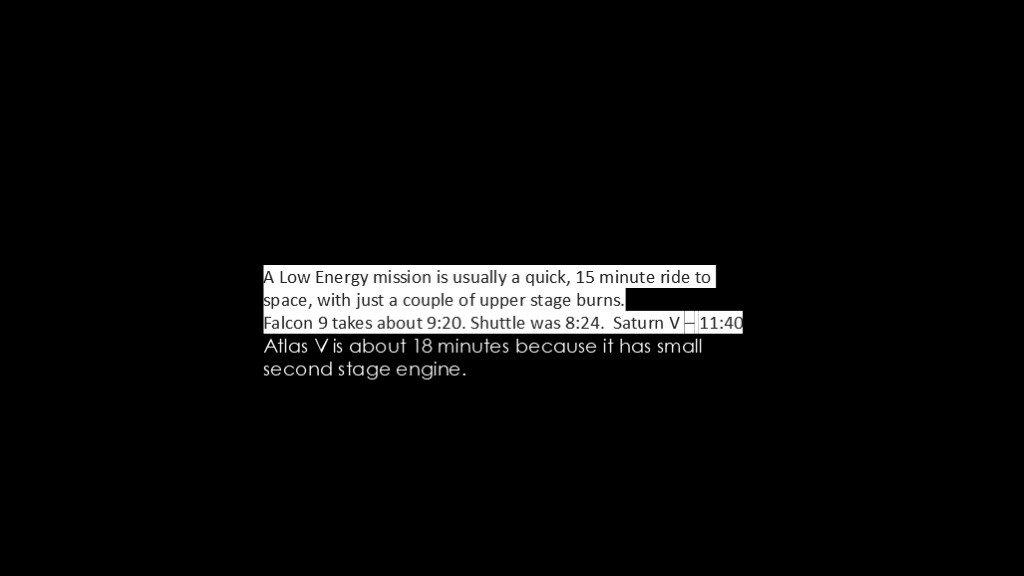
Perhaps like this, from a 2022 article by "Tory Bruno", which says the missions to the right have increasing difficulty and complexity. Apparently the 2020 Tory Bruno felt differently than the 2024 Tory Bruno.
As somebody who cares about effective presentation of data, the color coding on the bars is a bit confusing and you really need to start your Y axis at zero if you want to make it understandable.
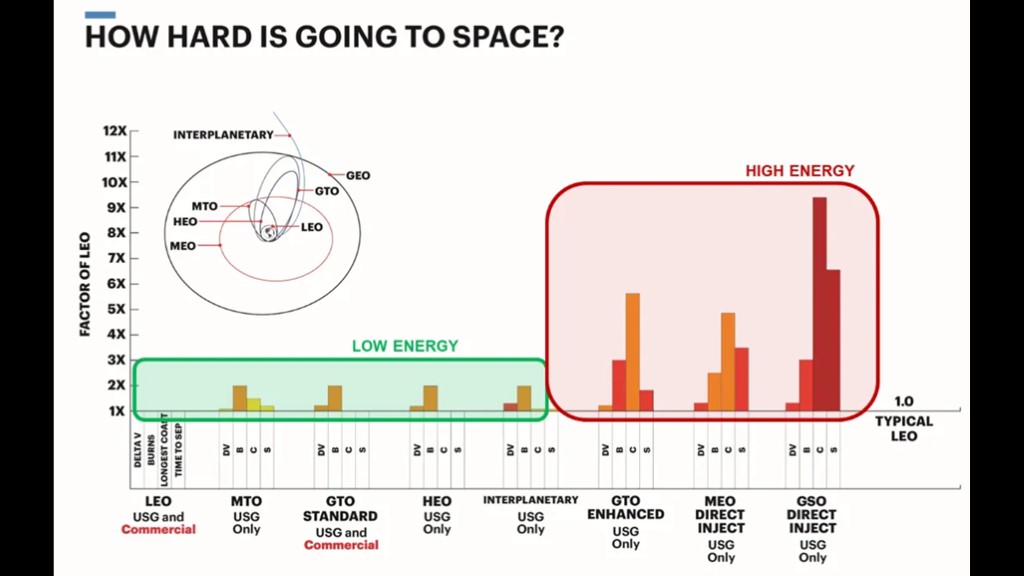
Switching back, ULA has decided that their new brand is "high energy".

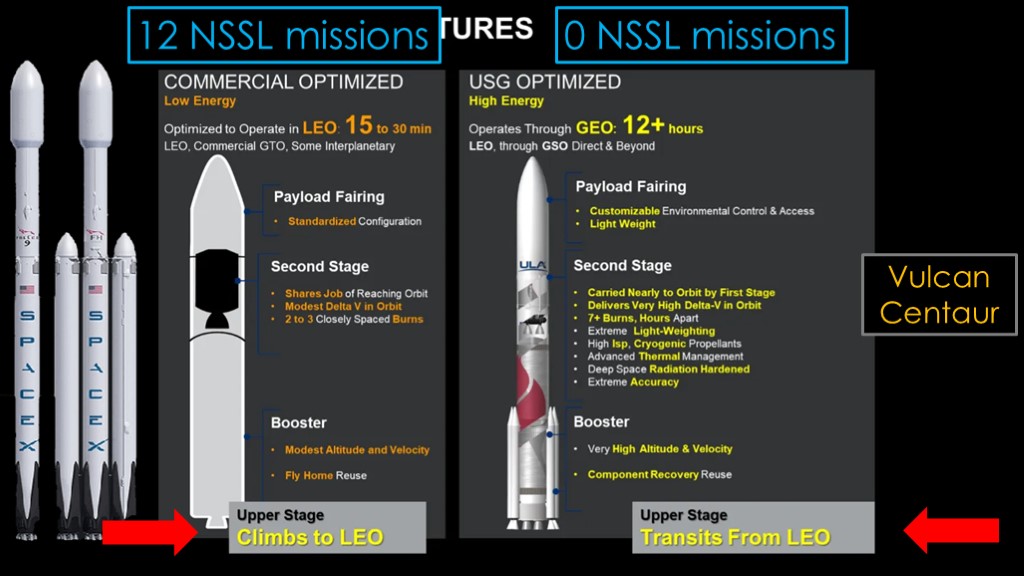
Let's move onto rocket architectures. This slide is comparing two rockets...
The rocket on the right is very obviously Vulcan Centaur. But what is this rocket? It's a weird generic rocket with a single first stage engine and a second stage inside of some kind of fairing. Since starship isn't aiming at this sort of market, we're going to assume that the rockets here are falcon 9 and falcon heavy.
I'm not going to go over all the individual items shown here, but I have a few thoughts to share.
The first is that most of the missions that that ULA is talking about are National security space launch missions for the department of defense, and SpaceX has flown 9 Falcon 9 missions and 3 Falcon Heavy missions as part of this program. Vulcan is a new rocket and has currently not certified to fly these missions, so it has flown zero missions of this category. That means that the things ULA is claiming are unique to ULA are already flying for SpaceX.
There's one more thing I want to cover here. ULA claims that the upper stage of the rocket climbs to low earth orbit, and that's certainly true; Falcon 9 stages low and early to make recovery and reuse possible.
It's this other claim that Vulcan's upper stage transits from low earth orbit.
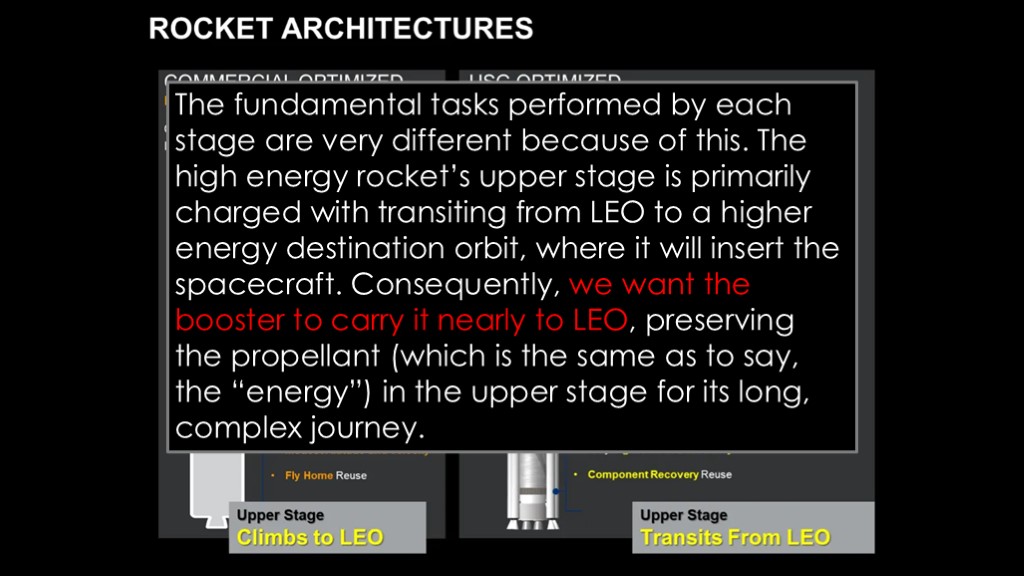
This is covered in the text as well...
Bruno writes, (read)
So, the assertion is that the Vulcan booster first stage will carry Centaur V nearly to LEO.
Interesting claim...
If you want the full slide that explains where I got these numbers, you can find it at the end of the video.
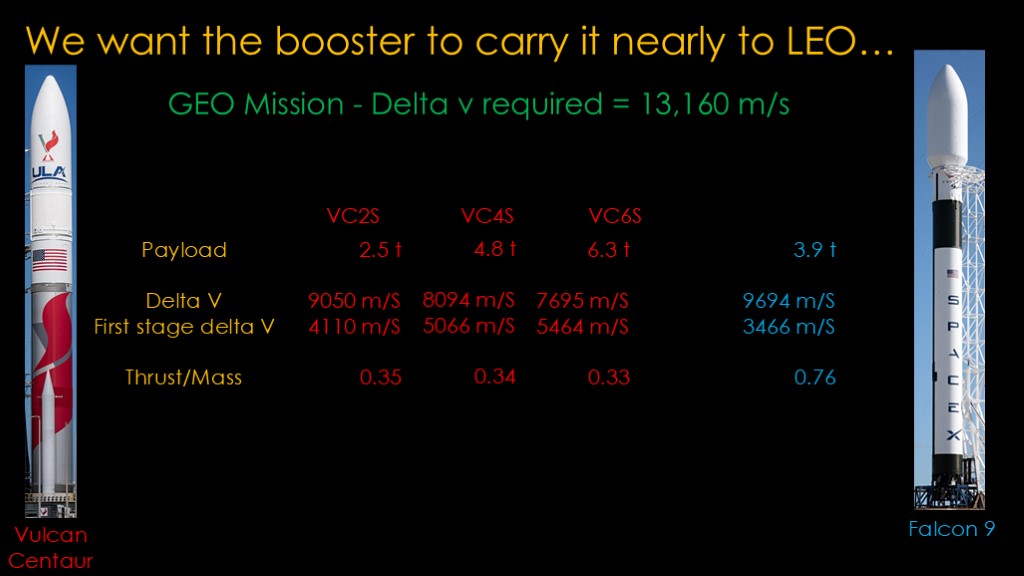
We have pretty good numbers on the new Centaur V stage and that means we can do some decent calculations. We are going to be looking at a mission all the way to geostationary orbit because that is the one that is the highest energy. Looking at the delta-v map of the solar system, we find that it takes 13,160 meters per second of delta v to get there. This is an approximate amount but it's good enough for our purposes.
Vulcan supports three different configurations for sending payloads go geostationary orbit. The two booster VC2S version can deliver 2.5 tons, the four booster VC4S version can deliver 4.8 tons, and the six booster VC6S version. There's also an "extended" version that uses a slightly more efficient engine so that Vulcan can deliver 7 tons to meet the NSSL requirement.
From the information we know about Vulcan centaur, we can figure out the amount of useful work it can do, measured in terms of delta v. We get 9050, 8094, and 7695 meters per second. This is very good performance - the Centaur V is a light stage and the engine it uses is very efficient.
We can now subtract these numbers from the 13,160 meters per second required to estimate the contribution of the first stage. We get 4110, 5066, and 5464 meters per second of delta v. Suffice it to say that none of these numbers are remotely near the amount of delta v it takes to get to LEO; the last one is only 59%.
I will of course compare these numbers to those of the Falcon 9. SpaceX does not publish payload numbers to geostationary orbit, so I'm using an estimate of 3.9 tons. With that payload, the second stage can generate 9694 meters per second of delta v and the booster contributes only 3466 meters per second. Much less than the Vulcan, which is not surprising because the Falcon 9 stages early.
We can also look at the thrust to mass of the second stages. The Centaur V thrust to mass ratio is very low - only about 0.35 - while the Falcon 9 thrust to mass ratio is about 0.76.
Why are these two designs so different?
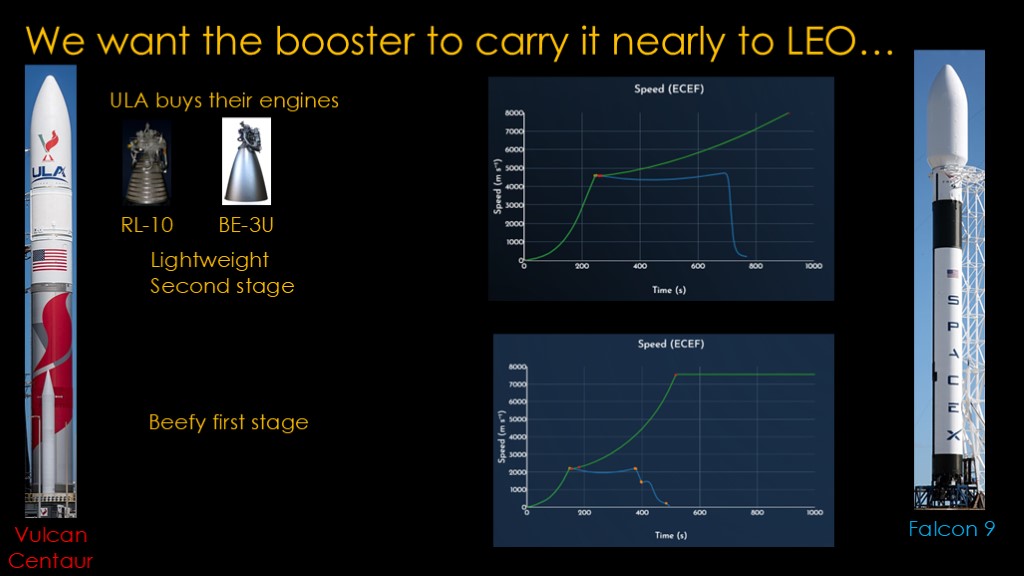
The big factor is that ULA buys their engines. For a long long time, the only engine you could buy for an upper stage is the RL-10, and ULA has used them for years. They are very efficient engines, burning liquid hydrogen and liquid oxygen but they are low thrust and they are expensive. Atlas II used two of them, Atlas III and Atlas V used a single one - perhaps to reduce costs - and the bigger Vulcan Centaur uses two of them. If the engines you can buy are low thrust the only thing you can do is build a less capable second stage and then a beefy first stage to get it where it needs to be.
Here's a example of an Atlas V launch; you can see that the first stage is great at accelerating but when the second stage kicks in the low thrust/weight ratio really penalizes the stage.
It's actually worse than it looks; if we look at the altitude graph we can see that the first stage puts a lot of energy into vertical velocity - using a lofted trajectory - so that the second stage can concentrate on horizontal speed.
That's one of the downsides of using the RL-10 in your second stage. But if you are ULA, your only other choice is to use the BE-3U from Blue Origin but since you already depend on their BE-4 for the first stage that's not very palatable.
Using this engine means that you need a big beefy first stage and you need to stage late because the thrust to weight ratio is so low that if you stage early, your second stage will fall back into the ocean.
Why are these two designs so different?
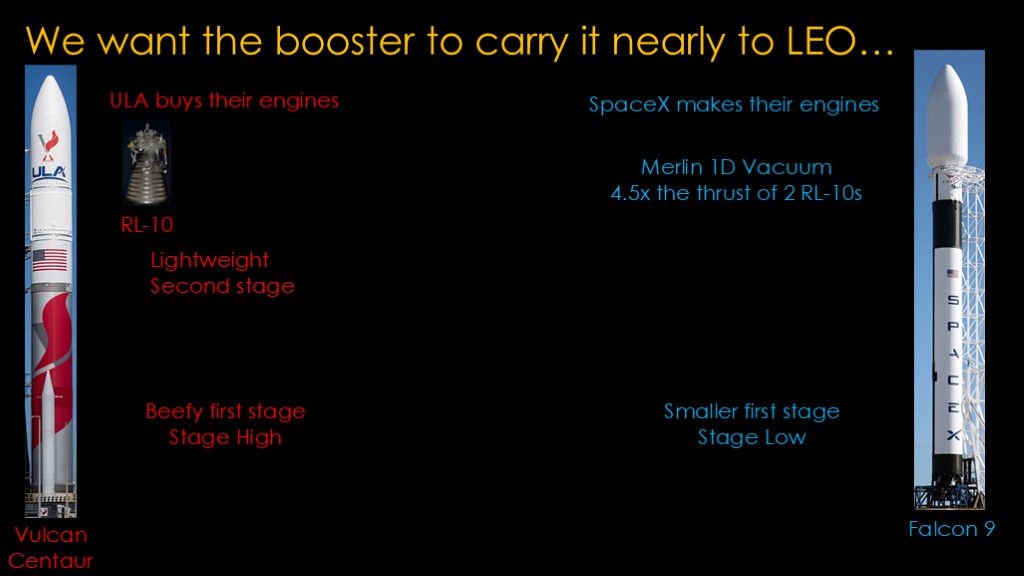
The big factor is that ULA buys their engines. For a long long time, the only engine you can buy for an upper stage is the RL-10. ULA has used them for years. They are very efficient engines, burning liquid hydrogen and liquid oxygen but they are low thrust and they are expensive. Atlas II used two of them, Atlas III and V used a single one - perhaps to reduce costs - and the bigger Vulcan Centaur uses two of them.
Here's a example of an Atlas V launch; you can see that the first stage is great at accelerating but when the second stage kicks in the low thrust/weight ratio really penalizes the stage.
It's actually worse than it looks; if we look at the altitude graph we can see that the first stage puts a lot of energy into vertical velocity - using a lofted trajectory - so that the second stage can concentrate on horizontal speed.
That's one of the downsides of using the RL-10 in your second stage. But if you are ULA, your only other choice is to use the BE-3U from Blue Origin but since you already depend on their BE-4 for the first stage that's not very palatable.
Using this engine means that you need a big beefy first stage and you need to stage late because the thrust to weight ratio is so low that if you stage early, your second stage will fall back into the ocean.






If you enjoyed this video, please send me this original painting, "Love in the time of Polaris", available for the modest sum of $5400.
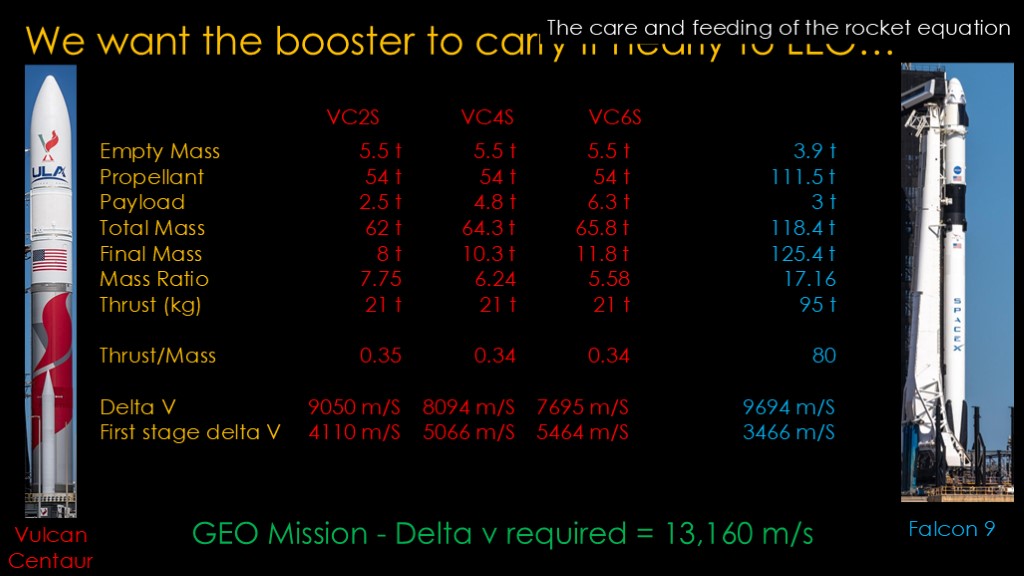
Okay. Let's do some fact checking. The rocket in the picture is clearly a Vulcan Centaur and we're going to be choosing a mission to geostationary orbit because that's the hardest when it comes to energy.
What we're going to do is calculate how much delta v that centaur v second stage will generate with the posted payloads, and we know that any delta v that the second stage can't generate must come from the current stage.
I'm using the best numbers that I could find but some of them will be wrong and delta-v estimation ignores a number of real-world effects like gravity losses, so the numbers are approximate.
The VC0S version without boosters can't get any payload to geostationary orbit, so we'll only look at the three other versions. We have a set of measures and calculations that we'll use.
There are some that are fixed - the empty mass of the stage is always 5500 kilograms, or 5.5 tons. The amount of propellant is always 54 tons, and the thrust of the two RL-10 engines is always 21 kilograms.
The payload to GEO for the VC2S version is only 2.5 tons, which puts the total mass at 62 tons and the final mass - the empty mass plus the payload mass - at 8 tons. That gives a mass ratio of 7.75 - the ratio of the starting mass full of propellant and the final mass empty of propellant.
With the total mass and thrust, we can calculate the thrust/mass ratio, and it's a disappointing 0.35. It's not uncommon for second stages to have ratios less than 1, but this is quite low. That is in line with "let the booster do all the work".
We can plug our numbers into the rocket equation and we find that this combination gives us 9050 meters per second of delta v. Which is a lot. If you want to know more about how that was calculated, see my video "the care and feeding of the rocket equation".
We know that our total delta v is around 13,160 meters per second, so that means the first stage furnished 4110 meters per second of delta v. Not an amount that I would call "nearly to LEO", which takes over 9000.
Hmm. Let's look at more boosters....
The only changes to the second stages are the slightly higher payloads which don't push the numbers around a lot.
We see that with 4 boosters the Centaur V second stage generates 8094 meters per second of delta v for a first stage contribution of 5066 meters per second.
With 6 boosters its 7695 meters per second of delta v, and a first stage contribution of 5464 meters per second.
Suffice it to say that none of these numbers are remotely near LEO; the last one is only 59%.